Albert Einstein said: "If you can't explain it to a six year old, you don't understand it yourself." I like to think this is true about explaining things to my parents.
As is the case for many people my age, my parents don't understand what I do. They're both in medicine and they have no background in math nor economics, while I'm a quantitative researcher at a hedge fund. In this post I will attempt to give a high-level explanation of one of the problems that I work on solving: power pricing. This is a simplified explanation that neglects details and edge cases.
Intro: the power balance
Power (or electricity) must be generated by power plants. That power is consumed by "load" (demand), often a load-serving entity (LSE) that distributes that power to other people. My parents are in northern California, where the LSE is Pacific Gas & Electric. Your electricity bill comes in kilowatt-hours (kWhr), but I typically think about things in megawatt-hours (MWhr).
At any given moment, the amount of power produced must exactly equal the amount of power consumed. This is called the "balance." If the grid does not balance, then the frequency of the grid will lower (or increase) from the 60 Hz that it must operate at. If the frequency of the grid is not exactly right, then it can cause serious damage to the power generators. This is why when the grid does not balance, generators prefer to completely shut down, causing brownouts or blackouts.
Why does the price for power change?
For some supply, it is very cheap to produce each MW of power. This is called the "marginal cost": the cost to produce an additional unit of power. Fuel types with very low marginal cost are solar, wind, and nuclear. Gas and coal have higher marginal costs.
If the demand is very low (such as in the middle of the night, called off-peak hours), then the cheapest producers will supply the electricity, and therefore the price is not very high. When demand increases, we must incentivize the less efficient producers to supply that power. It costs them more money to make the power, so the price increases.
The power is always supplied by the producer that minimizes the total cost to the system. This is ensured by a central organization called a regional transmission organization (RTO), to which all of the producers submit their marginal costs and LSEs submit their demand. The RTO in California is called CAISO, and my parents are in northern California, so they are specifically in the region called NP-15. Other RTOs include PJM, which covers where I live in Chicago, and ERCOT, which you might have heard about in Texas.
How is power traded?
Power is traded in many ways (you can trade the average price of power, the theoretical profitability of a coal-powered plant, the number of hot or cold days in a month, the ratio or difference between power and gas prices, etc.). I'm going to just give a couple of examples in this section.
A "forward" is an agreement to buy or sell something at a certain price in the future. So let's say I buy a forward on a banana for $10 one year from now. One year from now the contract settles and the market is pricing the banana at $25. That means I buy the banana at $10 (because of my forward) and I get to sell at $25, so I made $15 profit. If the price went down, then I would have lost money.
Now onto power: there is a "day-ahead" market for power, and a "real-time" market. I am not going to go into the details of the day-ahead market, but you can buy forwards on the day-ahead price.
The real-time market recalculates the price for power every 5 minutes throughout the day. The price is calculated using an optimization that is simplified below.
One of the most basic instruments is a "bal-day," short for balance of the day. The bal-day represents the average price for power over the peak hours in the real-time market. So in the morning you might see that you can buy the bal-day at $30, but you think the average price in the day will be $40. You would buy the bal-day, and then wait until the end of the day when the contract will settle, and you will make or lose the difference.
Another distinction is that most people will trade the average price of power over a given area called a "zone." But there are thousands of physical busses that people connect to, each of which has its own power price, and you can trade those via nodal trading (with instruments like FTRs and ARRs, again not worth going into).
How does the RTO figure out the market price for power?
So you might have seen graphs like this before:
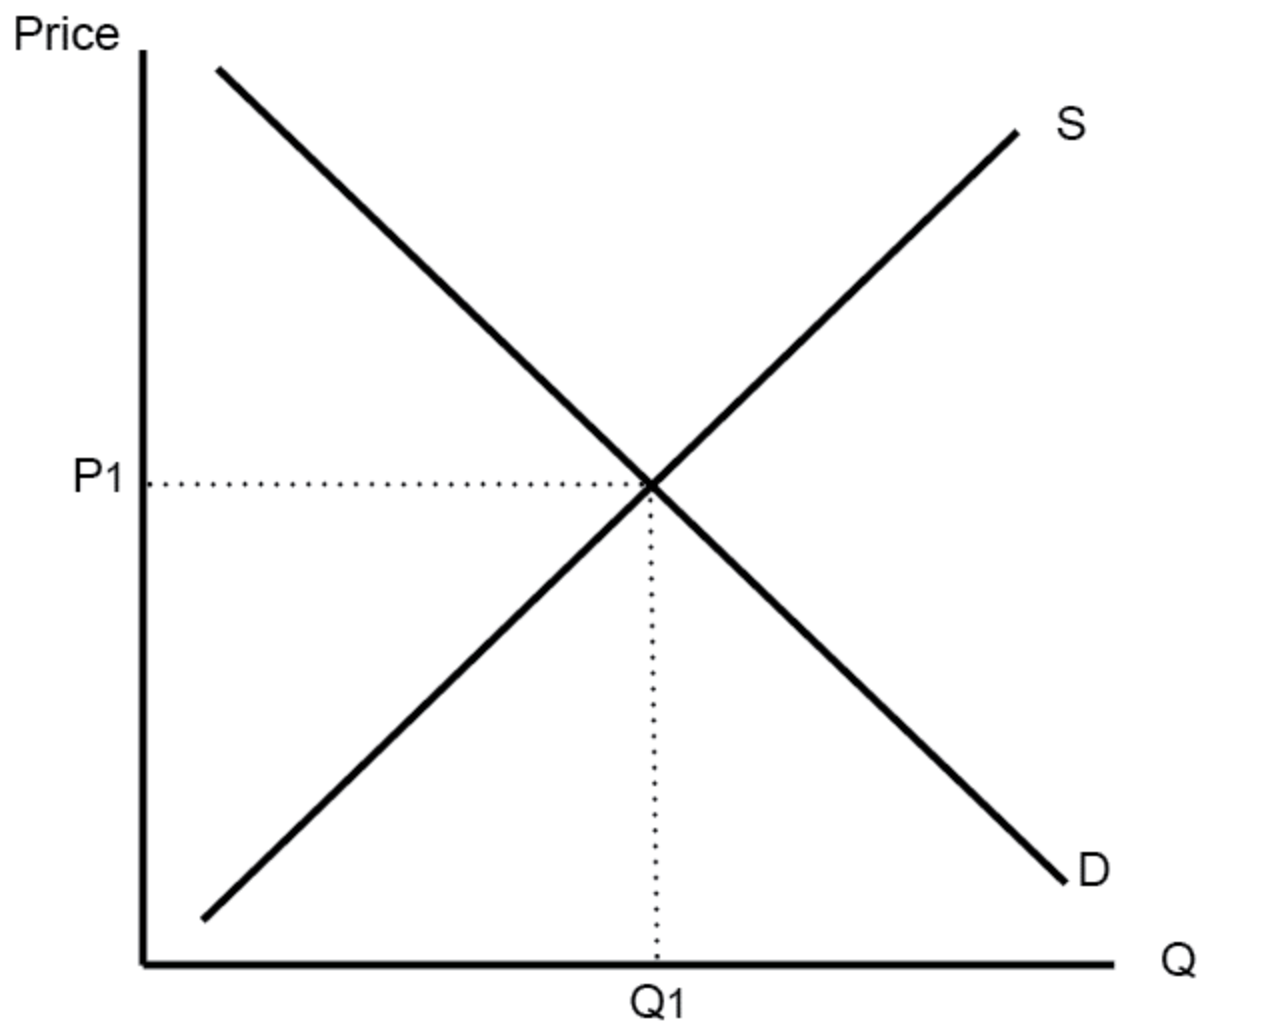
The line sloping downwards represents demand. As quantity increases (bottom axis), the price people are willing to pay also decreases. The upward sloping line represents supply. As we talked about above, for small quantities, the power does not cost much to produce, so people are willing to supply it for very cheap prices. As the quantity increases, the price that producers require also increases.
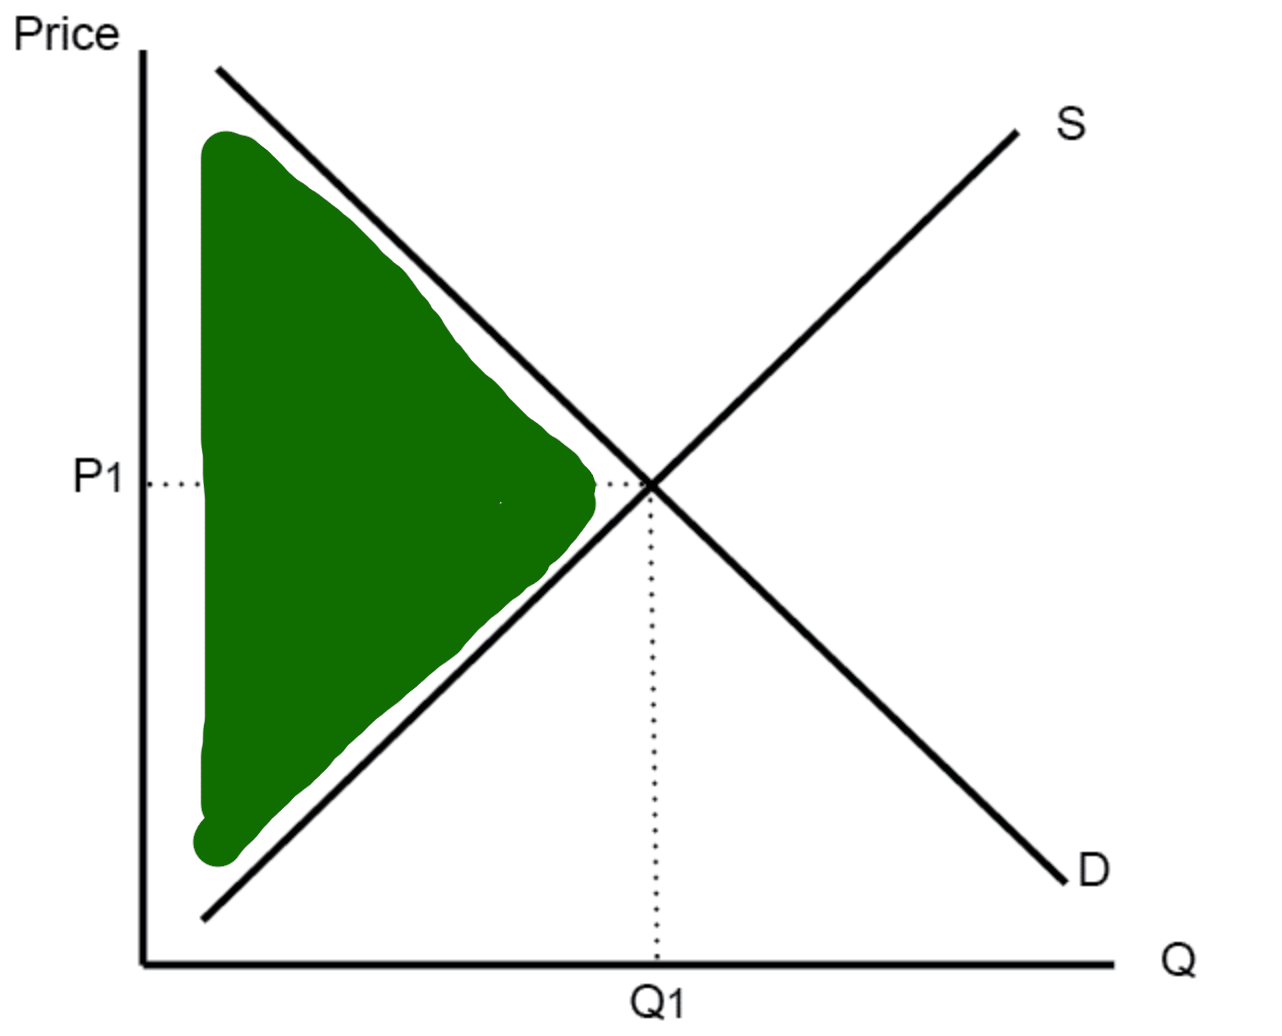
The area in green is called "economic surplus." It is good! We want to maximize that area, because it represents all of the people who are getting a good deal. The people who demand power got it way cheaper than they were willing to pay for it, and the producers are selling power for higher than they were willing to sell it for. In fact, the "efficient market price" is the price that maximizes this area.
For power specifically, demand is described as "inelastic," meaning it doesn't really change much even if the price changes. So the downward sloping line is almost a straight line down. Therefore maximizing this area is equivalent to just picking the cheapest suppliers to supply the power!
The problem is that we have "constraints." Power lines can only transmit so much power and producers can only supply so much. There are actually tons of other constraints that I won't go into. But in short, the problem statement looks something like this:
Maximize the the economic surplus (minimize the cost to produce power), subject to:
- (power supplied) = (demand)
- The amount of power transmitted across each line cannot exceed the line's capacity
- Each producer cannot produce more power than they have capacity
Or the formulation in the ISO New England (ISONE) slides:
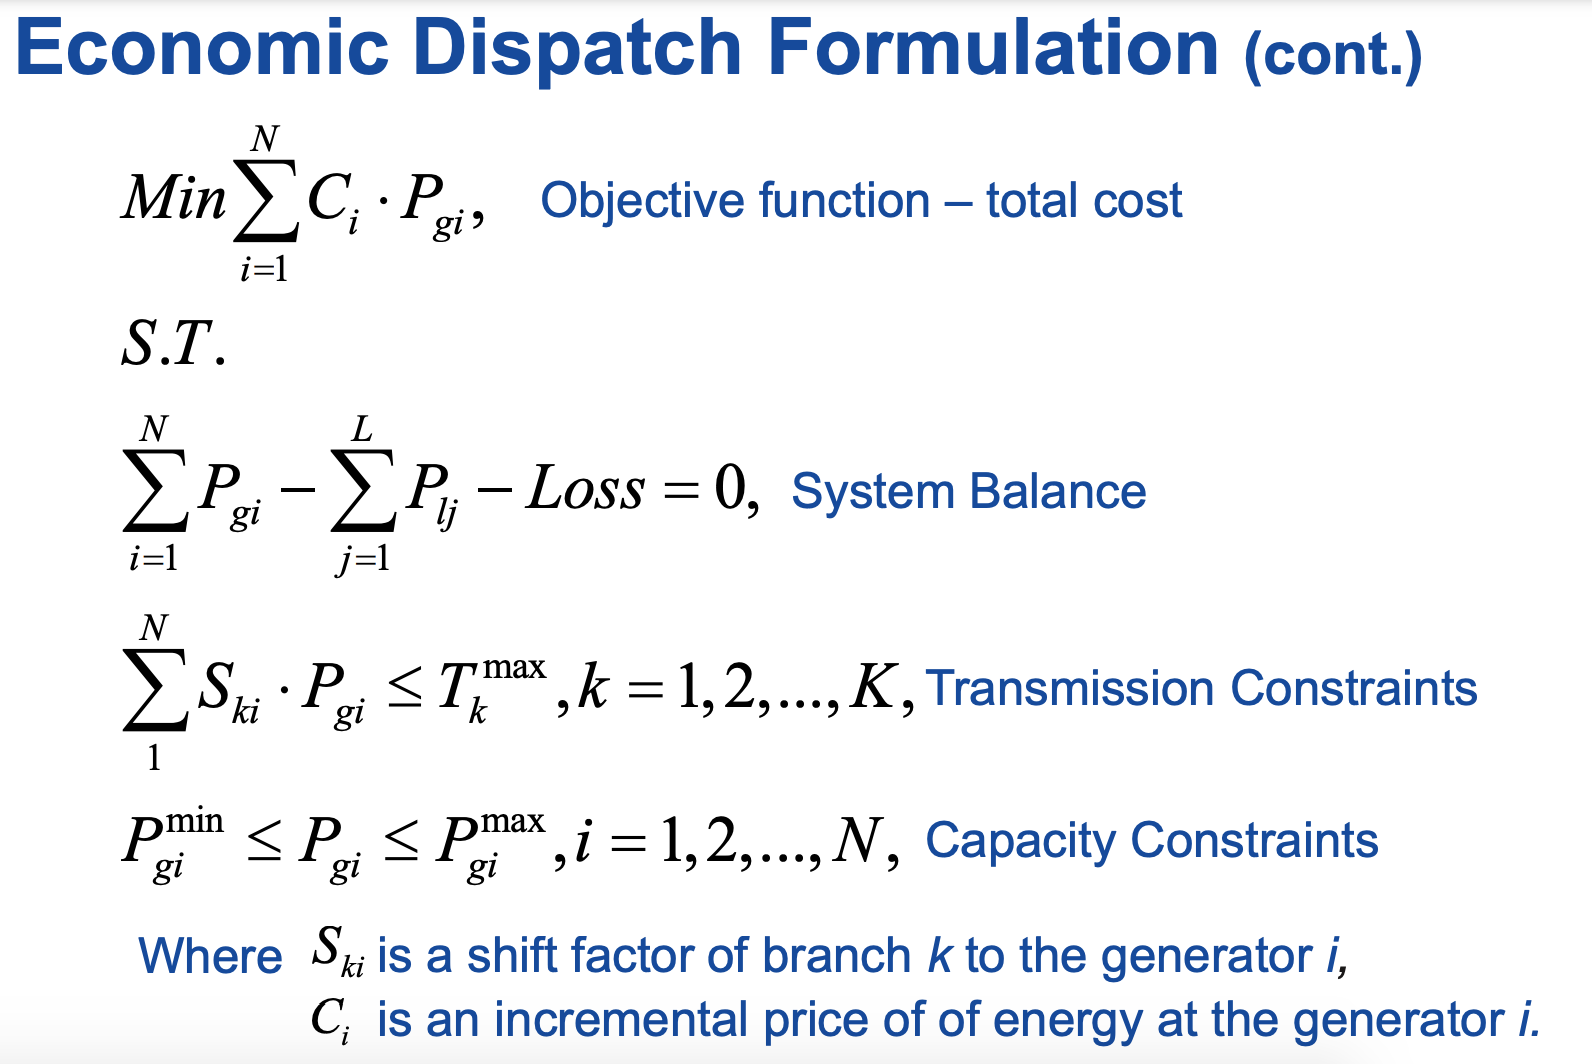
This model is called a production cost model. One thing that makes this more complicated is that generators have a "start cost": it costs them some amount of money to even turn on. Another complication is that power generators must either be fully on or fully off, and when they are on, they must pay a "no load cost," the cost of just existing while you're on.
This problem becomes complicated enough that it is a well-known type of problem, called a mixed integer program (MIP), equivalent to the hardest problems in computer science. What's nice about this model is that if you solve it, one of the outputs ends up being the price at each location. It takes hours to solve the complete version of this problem.
So what do I do exactly?
I develop various models to get the possible outcomes for a variety of different investments. I hope this is helpful!